Jeff Clark | Aug 7th 2019, 5:37:58 am
Many readers liked the tables we presented of possible gold/S&P 500 ratios and what that would mean to prices of each asset. If you didn’t catch it, check out what the future could look like for gold vs. the stock market. Given the current action in stocks and precious metals, I decided to run the same scenarios for silver. In other words, if the silver/S&P 500 ratio returned to any of its past highs, what would the prices for each look like? Hold on to your hats, because the title of this article was no exaggeration…
Many readers liked the tables we presented of possible gold/S&P 500 ratios and what that would mean to prices of each asset. If you didn’t catch it, check out what the future could look like for gold vs. the stock market.
Given the current action in stocks and precious metals, I decided to run the same scenarios for silver. In other words, if the silver/S&P 500 ratio returned to any of its past highs, what would the prices for each look like?
Hold on to your hats, because the title of this article was no exaggeration…
Silver’s inverse correlation to the S&P 500 is not as strong as gold’s. Stocks fall and gold tends to rise—but silver is not necessarily an anti-stock asset.
Because of its high industrial use, silver is susceptible to other factors. In fact, in sudden stock market crashes, the silver price has usually fallen with it.
So why would we look at this ratio? Because there are factors that push them in opposite directions. Monetary issues, safe haven needs, and inflation, to name a few.
Since the 1970s, we’ve seen silver and the stocks react differently to certain events a number of times. And during these periods that have been bearish for stocks and bullish for silver, the ratio has indeed climbed to high levels.
But perhaps the biggest factor now is their current prices. Stocks have been making new highs for literally a decade now (even with today’s fall, stocks are up 15% YTD), while silver has suffered a punishing bear market that has left many primary producers unable to turn a profit.
In other words, prices between these two assets are at such extreme ends that even just a mild rise in the ratio would lead to a huge reversal in stocks and a massive climb in silver.
Here’s a quick view of the history…
Here’s the 50-year history of the silver/S&P 500 ratio. The highs are noted, along with the current reading as of the end of July.

The current ratio of 0.0055 is near all-time lows. It had lower readings only during the late 1990s/early 2000s, and the early 1970s.
Look how high the ratio would have to climb in order to match some of the prior highs—anywhere from seven to a whopping 80 times.
So like we did with gold, let’s look at what would happen to silver and the S&P 500 if the ratio returned to any of those prior highs.
The following tables show the prices and percentage loss of the S&P 500, at various silver prices, if the three ratios above were matched from current levels.
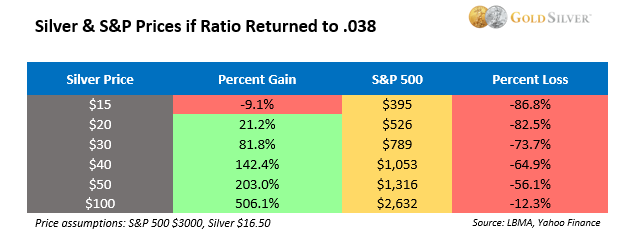
To keep it simple, the tables are calculated from 3,000 for the S&P and $16.50 for silver.
First, here’s what the gains would be in silver vs. the losses in the S&P, if the ratio returned to its 2011 high of .038.

Because their prices are at such polar opposites, there is no scenario where the S&P doesn’t experience losses in an environment where the ratio rises to this level.
If silver simply returned to the $50 level—more than a triple from current prices—the S&P 500 would lose over half its value. Do a little research and you’ll come to the conclusion that based on history, this is not a far-fetched scenario.
While this outcome is sobering to contemplate, it only gets worse for stock owners. Here’s what silver and S&P prices would look like if the ratio matched its 1983 high of 0.1.

In all scenarios, the S&P would lose over half its value at this ratio. While silver reaching $100 would represent a six-fold gain from current prices, common stocks would lose a whopping two-thirds of their value.
Even if silver only hit $50, investors who stubbornly held on to their stocks would see over 83% of their wealth evaporate.
And here’s the biggie, a rematch of the 1980 high of 0.44. This one should almost come with a warning.

Stock investors would experience a complete wipeout. There would be little value left. All this while the silver price climbs higher and higher.
If this extreme scenario played out, it would make our exit very easy to identify. Silver (and gold) would be so overvalued to stocks that it would send a clear signal to sell precious metals and buy deeply undervalued stocks.
While most of these tables represent a massive selloff in stocks and a huge climb in silver, keep in mind that these are not pretend prices, model projections, or wishful thinking. All these ratios have occurred before.
Given that the ratio currently sits near record lows, the odds of it moving significantly higher are very high.
Are you ready?
***
Connect With Us:
Twitter | Facebook | LinkedIn | Instagram
To view this original article, please visit: https://goldsilver.com/blog/silver-vs-the-sp-500-history-says-one-could-be-crushed-the-other-a-life-changing-bubble/
Your Money is Naked: Five Reasons Everyone Should Store Some Gold Outside Their Home Country—and Where to Do So | Dec 3, 2024
GOLD: Here’s What’s Happening Right Now | May 23, 2023
Gold in Q1: Hello, Banking Crisis | Apr 19, 2023